Overview
The boxwood blight infection risk mapping tool produces forecasts of the risk of boxwood being infected by boxwood blight in western Oregon and Washington. This information may help with planning scouting activities and with efforts to prevent or mitigate infections (e.g., with fungicide treatments). Forecasts are available for each day between tomorrow and four days from today. Climate data are derived from the PRISM database at a 800 m2 resolution and from the NDFD database (downscaled from a 2.5 km2 to an 800 m2 resolution). Presently models are run only for areas west of the Cascades (approximately west of –120.5°W). Please see a tutorial for details on tool use and map interpretation. Expand the Introduction below to learn more about boxwood blight and risk models for this disease.
About
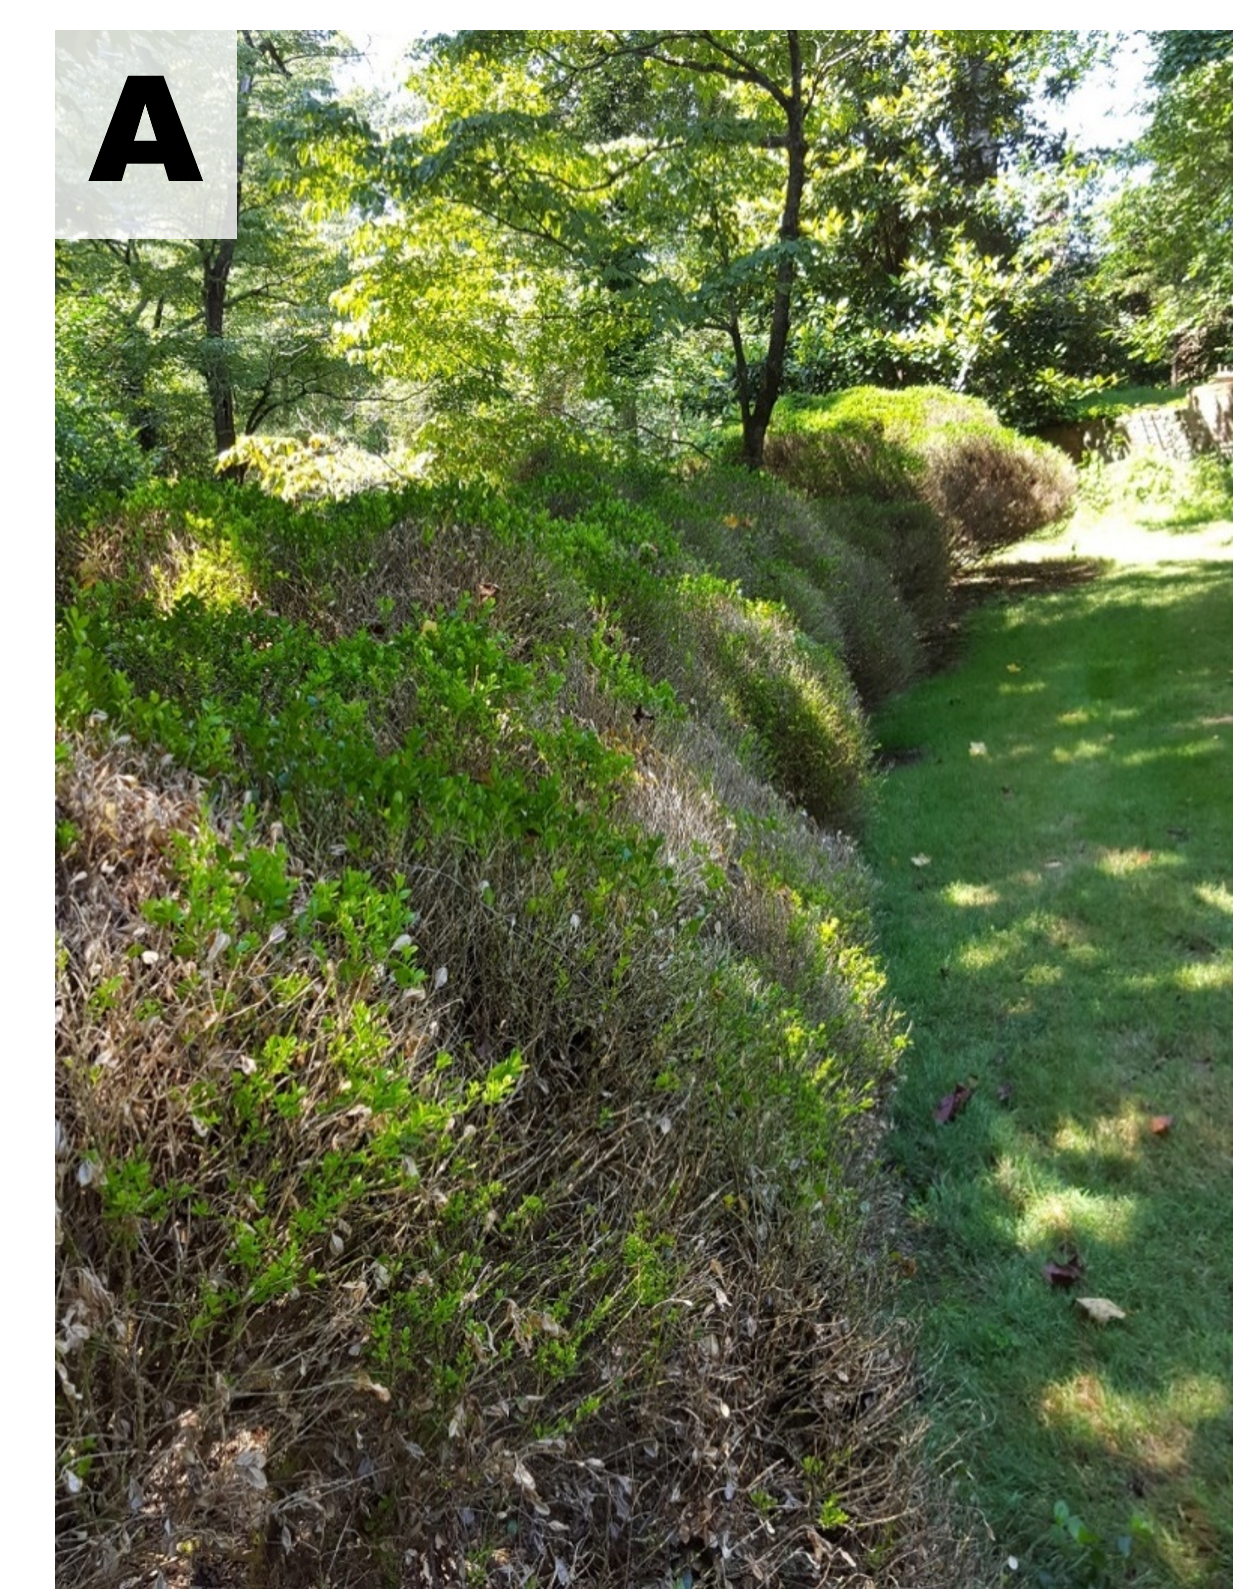
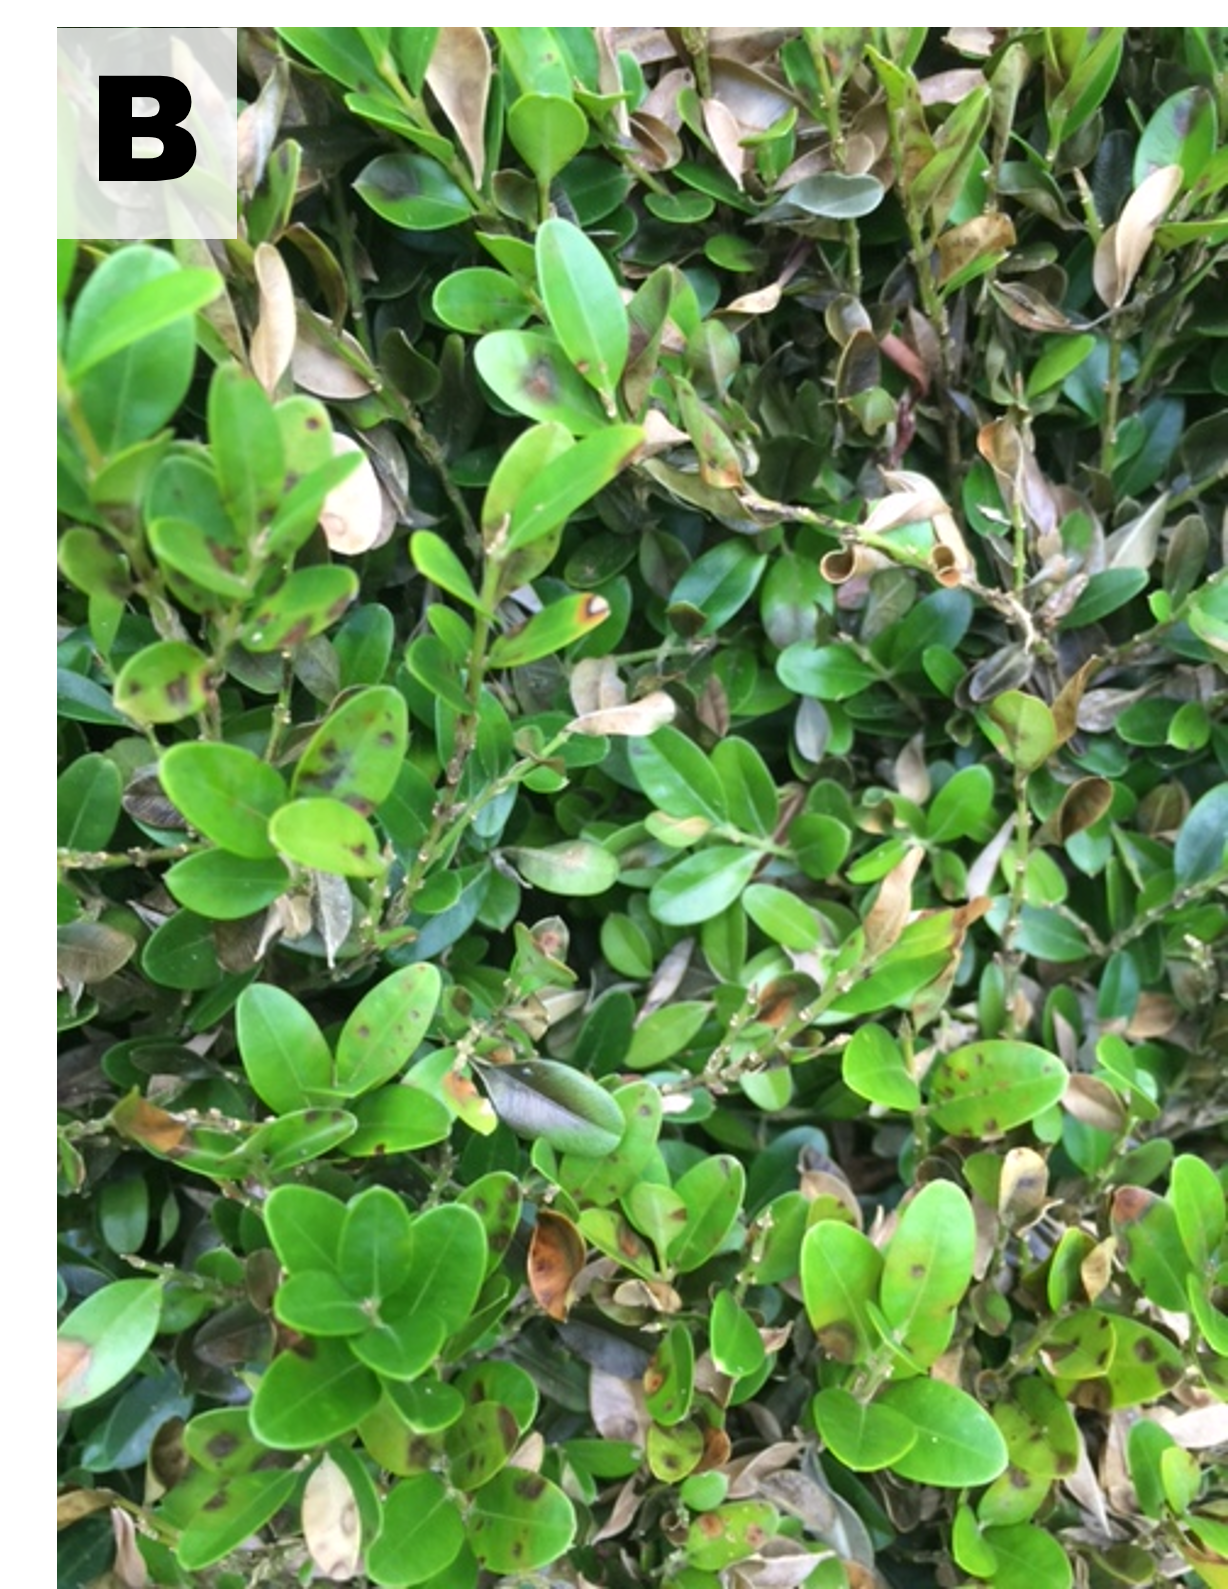
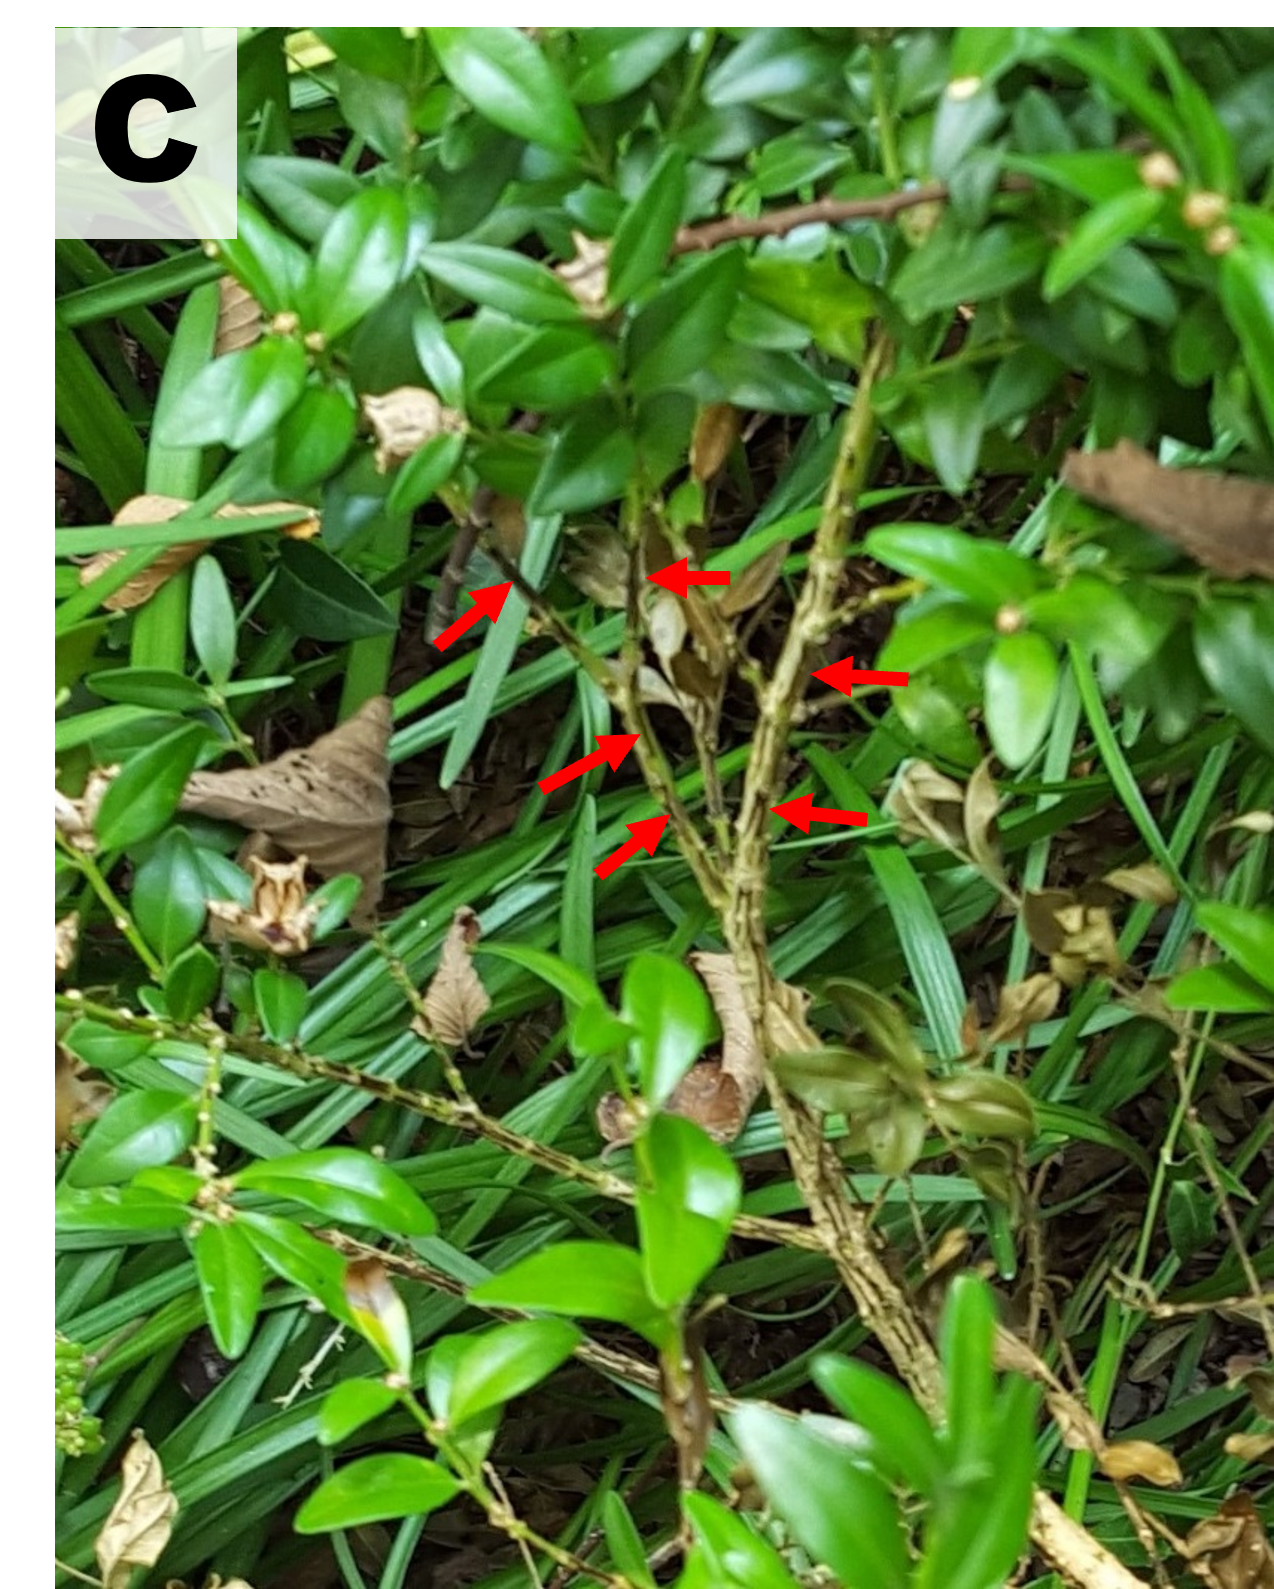
Introduction: Boxwood blight caused by the fungus Calonectria pseudonaviculata can result in defoliation, decline, and death of susceptible varieties of boxwood, including most varieties of Buxus sempervirens such as "Suffruticosa" (English boxwood) and "Justin Brouwers". Images show diagnostic symptoms of boxwood blight including (A) defoliation, (B) leaf spots, and (C) black streaks on stems (courtesy of Chuan Hong). The fungus has been detected at several locations (mostly in nurseries) in at least six different counties in Oregon and is thought to be established in some areas. Previous research indicates that western Oregon and Washington have highly suitable climates for establishment of C. pseudonaviculata . Tools are therefore needed to inform growers and gardeners about when environmental conditions are conducive to boxwood blight infection and establishment.
Generally, it should be very humid or raining and at moderately warm temperatures (60–85°F) for a couple days for boxwood blight infection risk to be high. An inoculum source must be present nearby for infection to occur. Overhead irrigation facilitates outbreaks because it creates higher relative humidity and exposes leaf surfaces to longer periods of leaf wetness. For more information on preventing and managing boxwood blight, see the Pacific Northwest Pest Management Handbook and a publication by Virginia Cooperative Extension.
Tool description: The risk mapping tool is similar to the boxwood blight model app and the synoptic map-view of risk available at USPest.org except that it uses daily gridded climate data instead of hourly climate data from single weather stations. The spatial model is run using a modified version of a platform known as DDRP, which provides real-time forecasts of phenology and establishment risk of 16 species of invasive insects in the contiguous US. It will likely need to be fine-tuned as more infection incidence data become available. Technical information on the station-based (hourly) model can be found at USPest.org.
Suggested citation: Barker, B. S., and L. Coop. 2023. Boxwood blight risk mapping app for western Oregon and Washington. Oregon IPM Center, Oregon State University. https://riskmaps.oregonstate.edu/boxb/.
Source code and feedback: To view the source code, visit the GitHub repository. To report bugs or provide feedback, please e-mail Brittany Barker at brittany.barker@oregonstate.edu.
Disclaimer: The risk index is intended to inform your decisions about management actions, such as choice and timing of control measures and intensity of scouting. It should supplement, not replace, the other factors you consider in making these decisions. Use at your own risk.
Risk Map
Legend
Very Low Risk
Low Risk
1st Infec. Susc. Vars.
Up to 1–6 Lesions
Up to 5–18 Lesions
Acknowledgements
Creation of this app was funded by Oregon Department of Agriculture Nursery Research Grant no. ODA-4310-A. Boxwood blight risk modeling work was funded by the US Farm Bill FY17, USDA APHIS PPQ agreement number 20-8130-0282-CA, and USDA NIFA CPPM Extension Implementation Program grant no. 2021-70006-35581. Many collaborators from OSU, USDA ARS, Virginia Tech, and North Carolina State University helped improve the model.